GL Account Flux Explainer
Download
Explain what drove the change in a general-ledger account between two periods — straight from a spreadsheet export. Upload a GL/transaction file, answer three questions (which account, which two periods, which subsidiary), and get back a formatted Excel workbook that names the vendors behind the move and quotes the memo text that proves it.
No accounting system, database, or connection required. The spreadsheet you upload is the data source, so anyone can run it on their own export.
Solving Flux
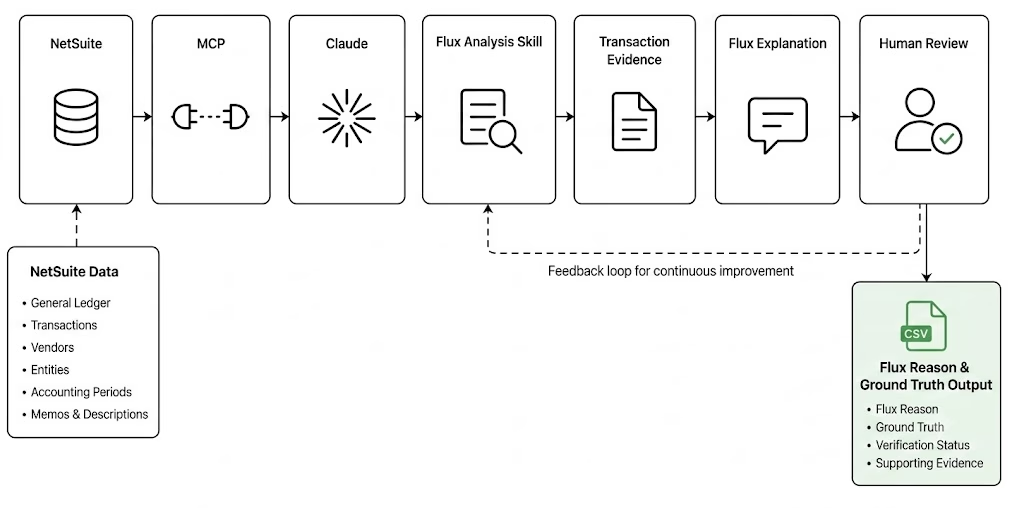
Every month, someone in finance has to answer "why did this account go up $61K?" The honest answer lives in the general ledger — which vendor moved, whether a contract is new or cancelled, what the line memo actually says — but digging it out by hand means pivoting a messy export, eyeballing hundreds of lines, and manually reconciling currencies and entities. People often end up guessing a plausible-sounding reason instead of grounding it in the data.
This skill does that dig automatically and, crucially, won't invent a reason the data doesn't support. Every driver it reports is tied to a real transaction and a quoted memo.
It also catches two mistakes that silently corrupt manual flux analysis:
- Mixed-currency totals — summing GBP + EUR + USD as if they were one unit. The skill translates each subsidiary to one reporting currency at its own rate first.
- Entity-level miscoding — a +$400K in one entity offset by −$400K in another, netting to near-zero at the consolidated level so it looks fine. The skill re-checks by entity and flags these for review.
What you get
An Excel workbook with:
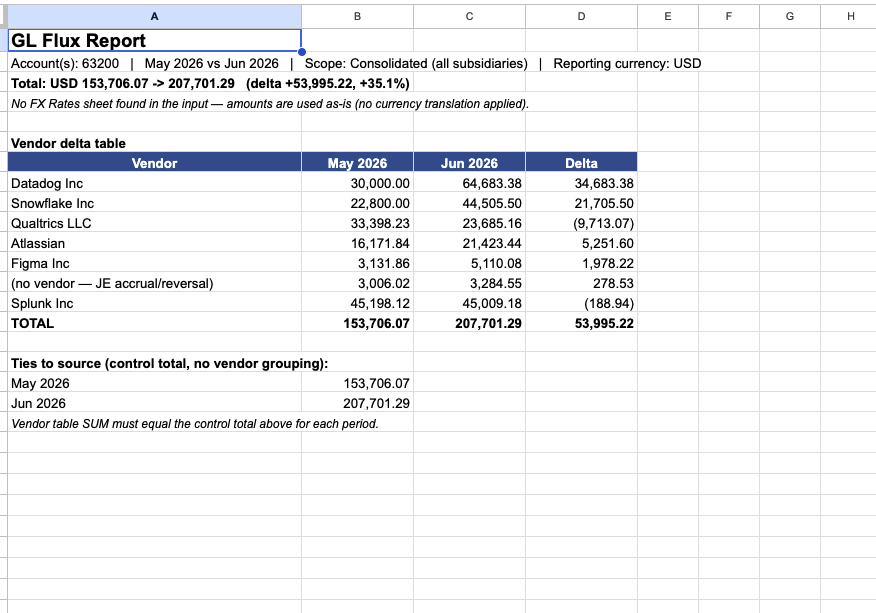
- Summary — the headline number, the full vendor delta table, and a reconciliation line proving the total ties to the source.
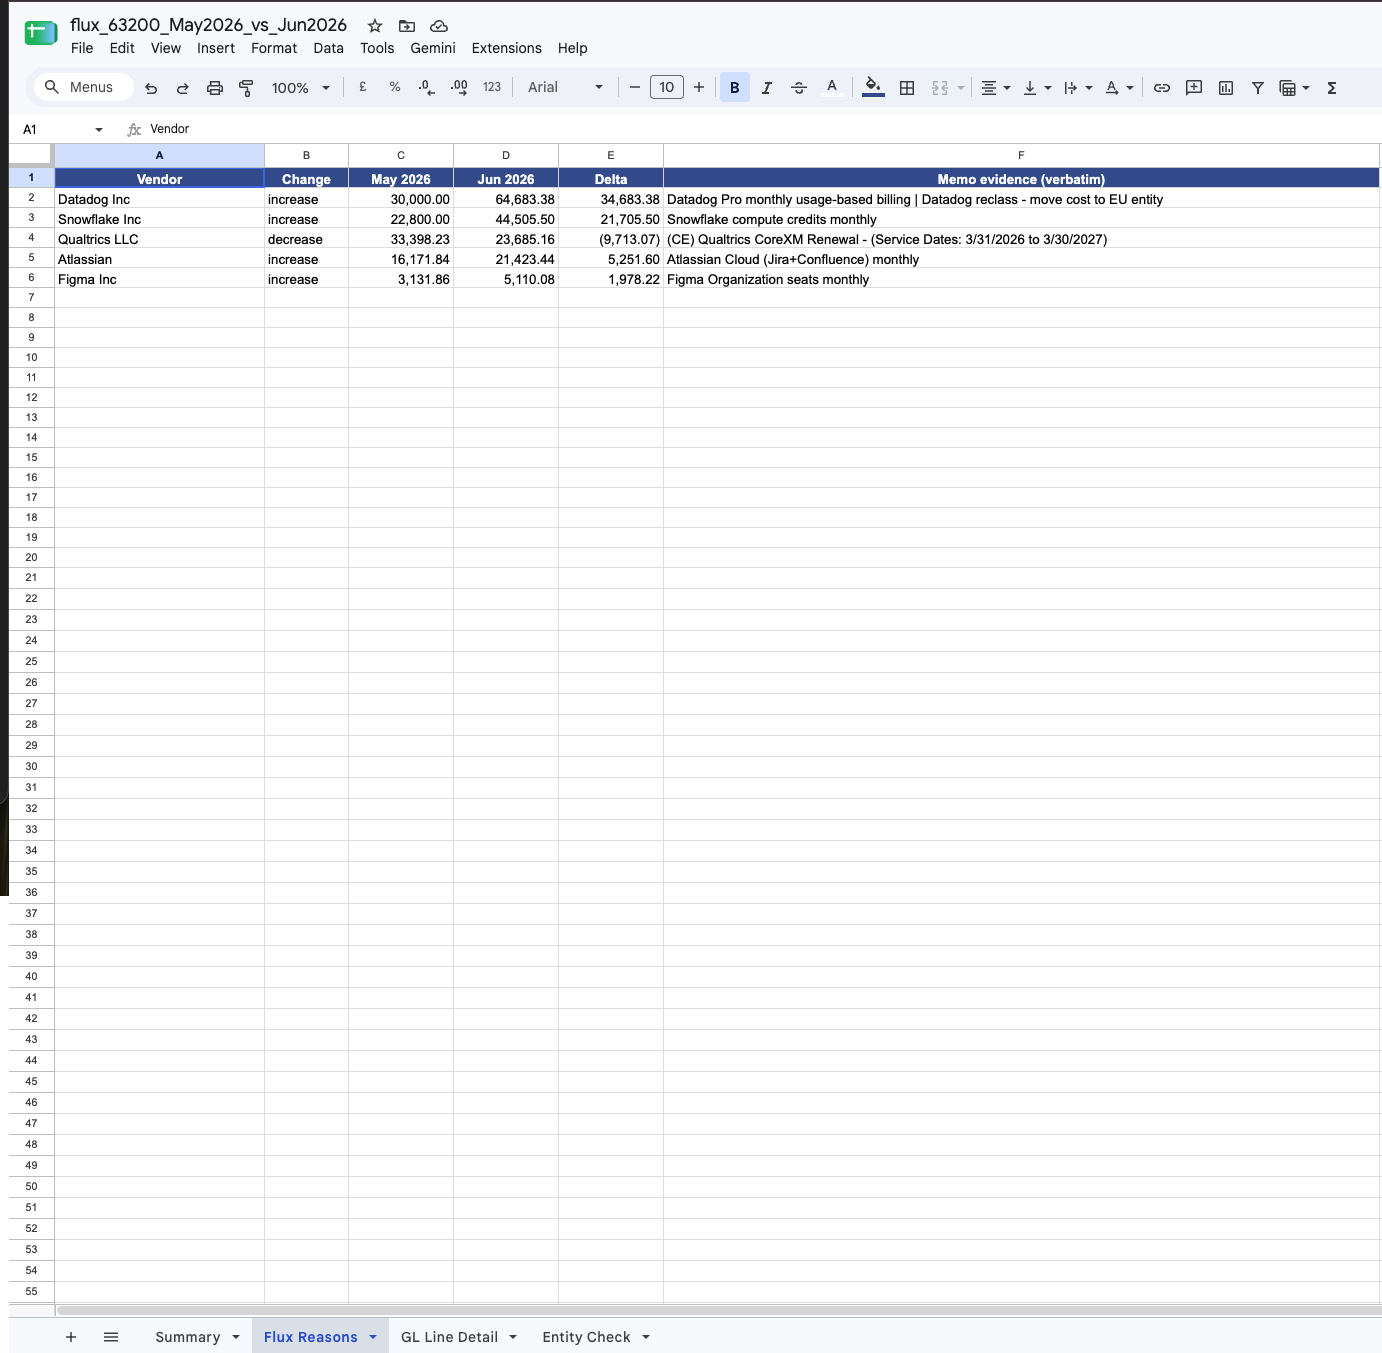
- Flux Reasons — the top movers, each with the verbatim memo that explains it.
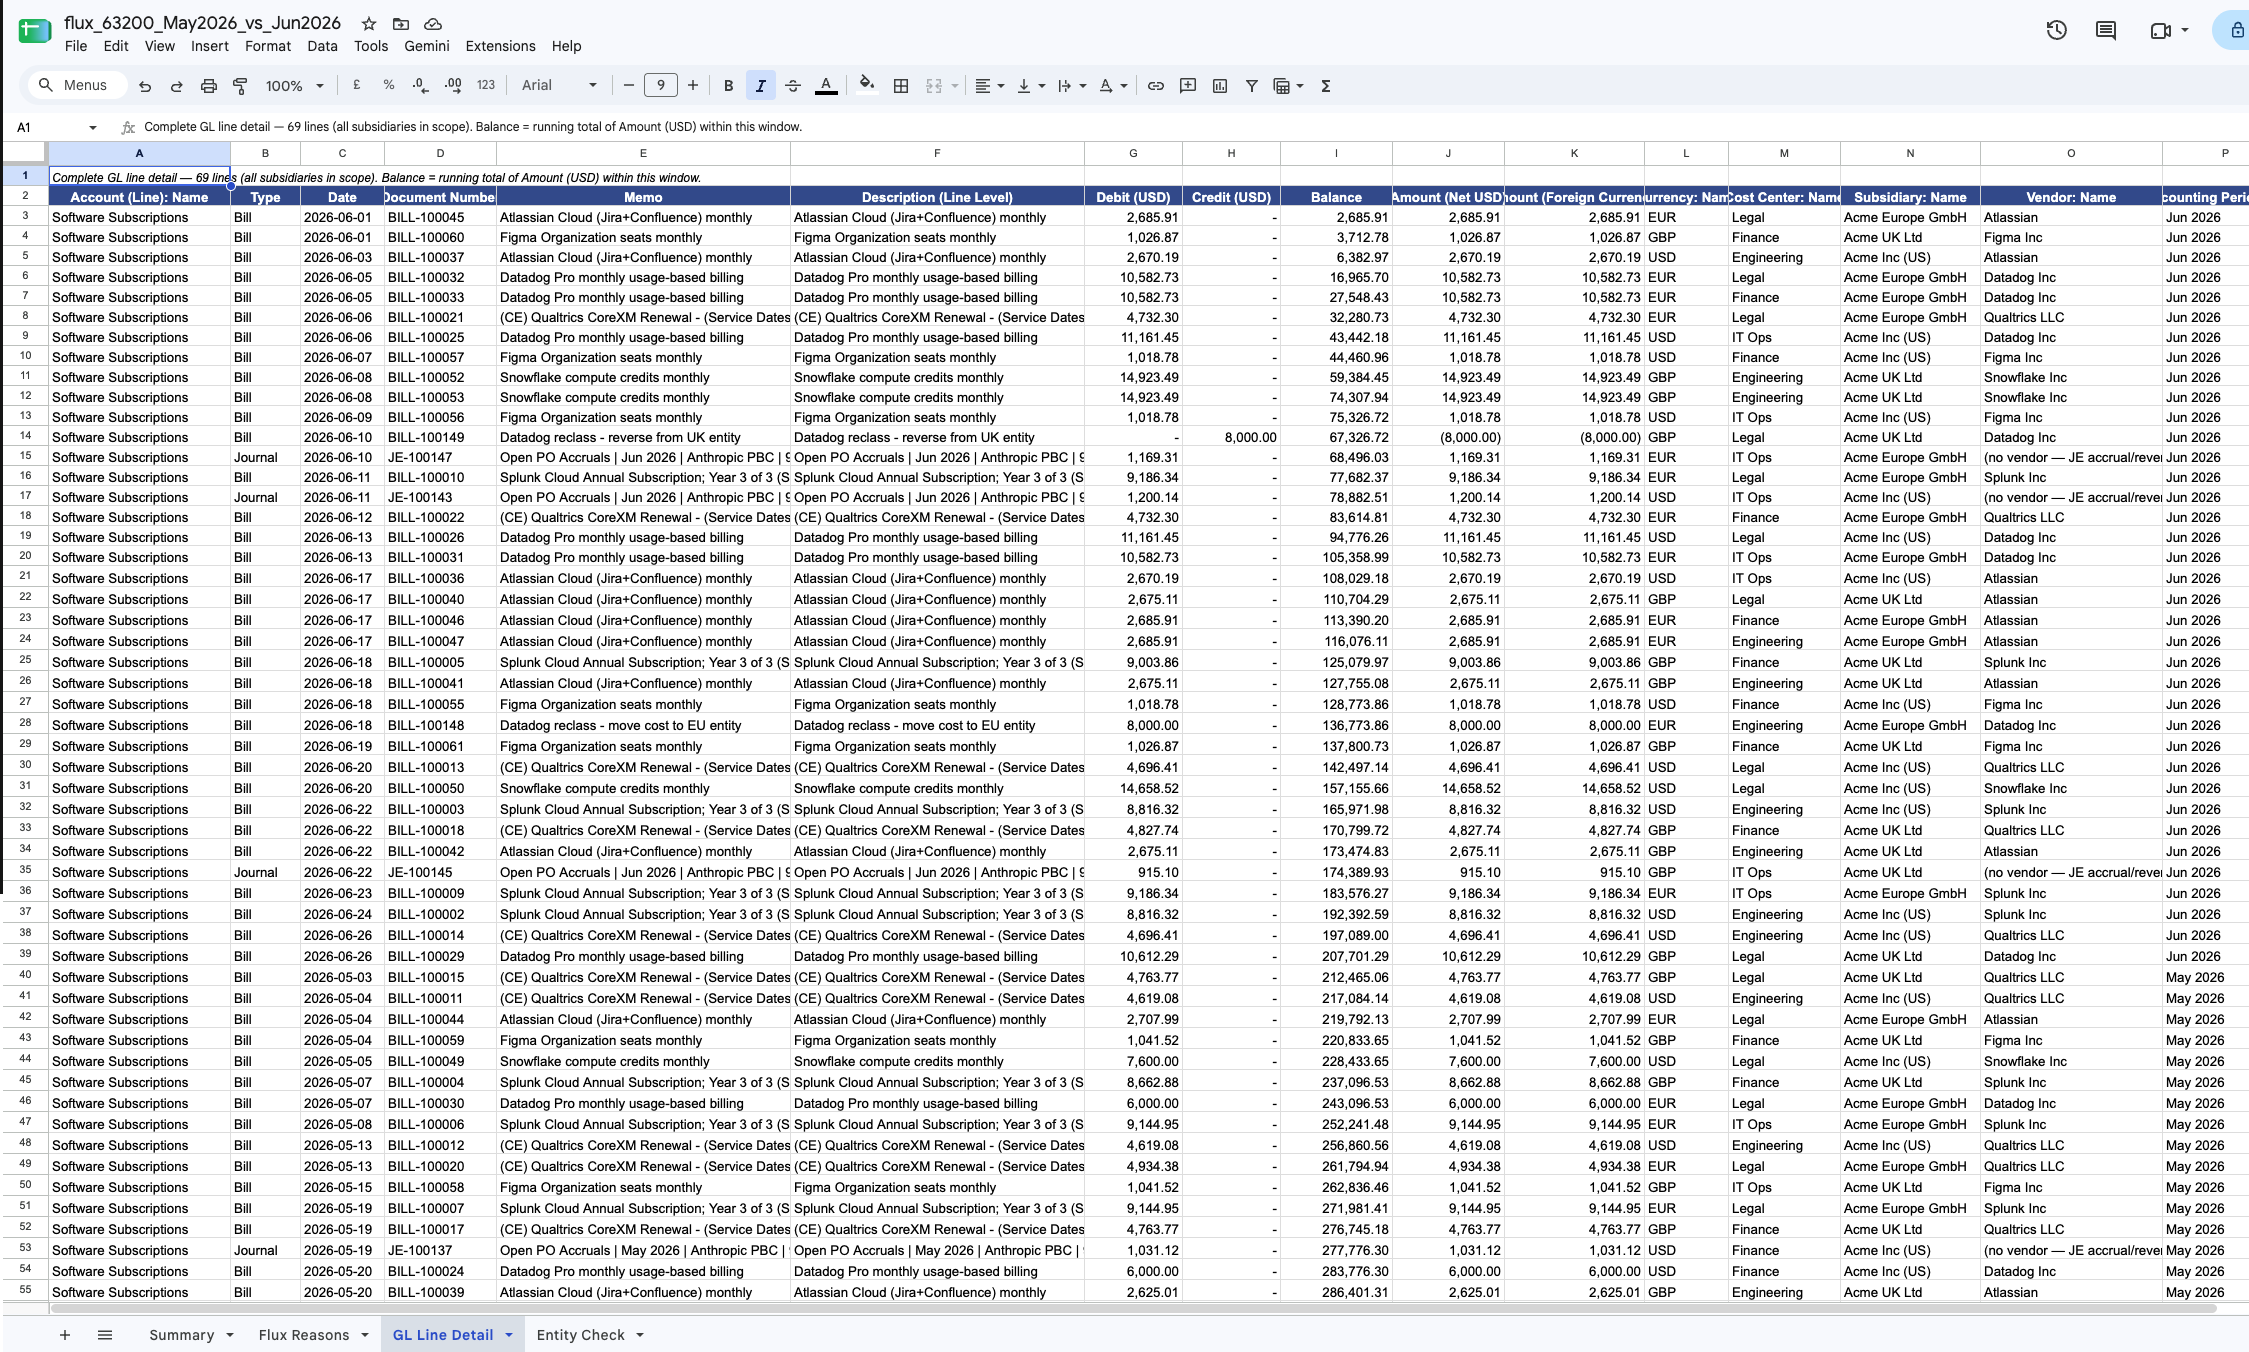
- GL Line Detail — every line in scope, in a standard GL-detail layout, in one reporting currency, with a running balance.
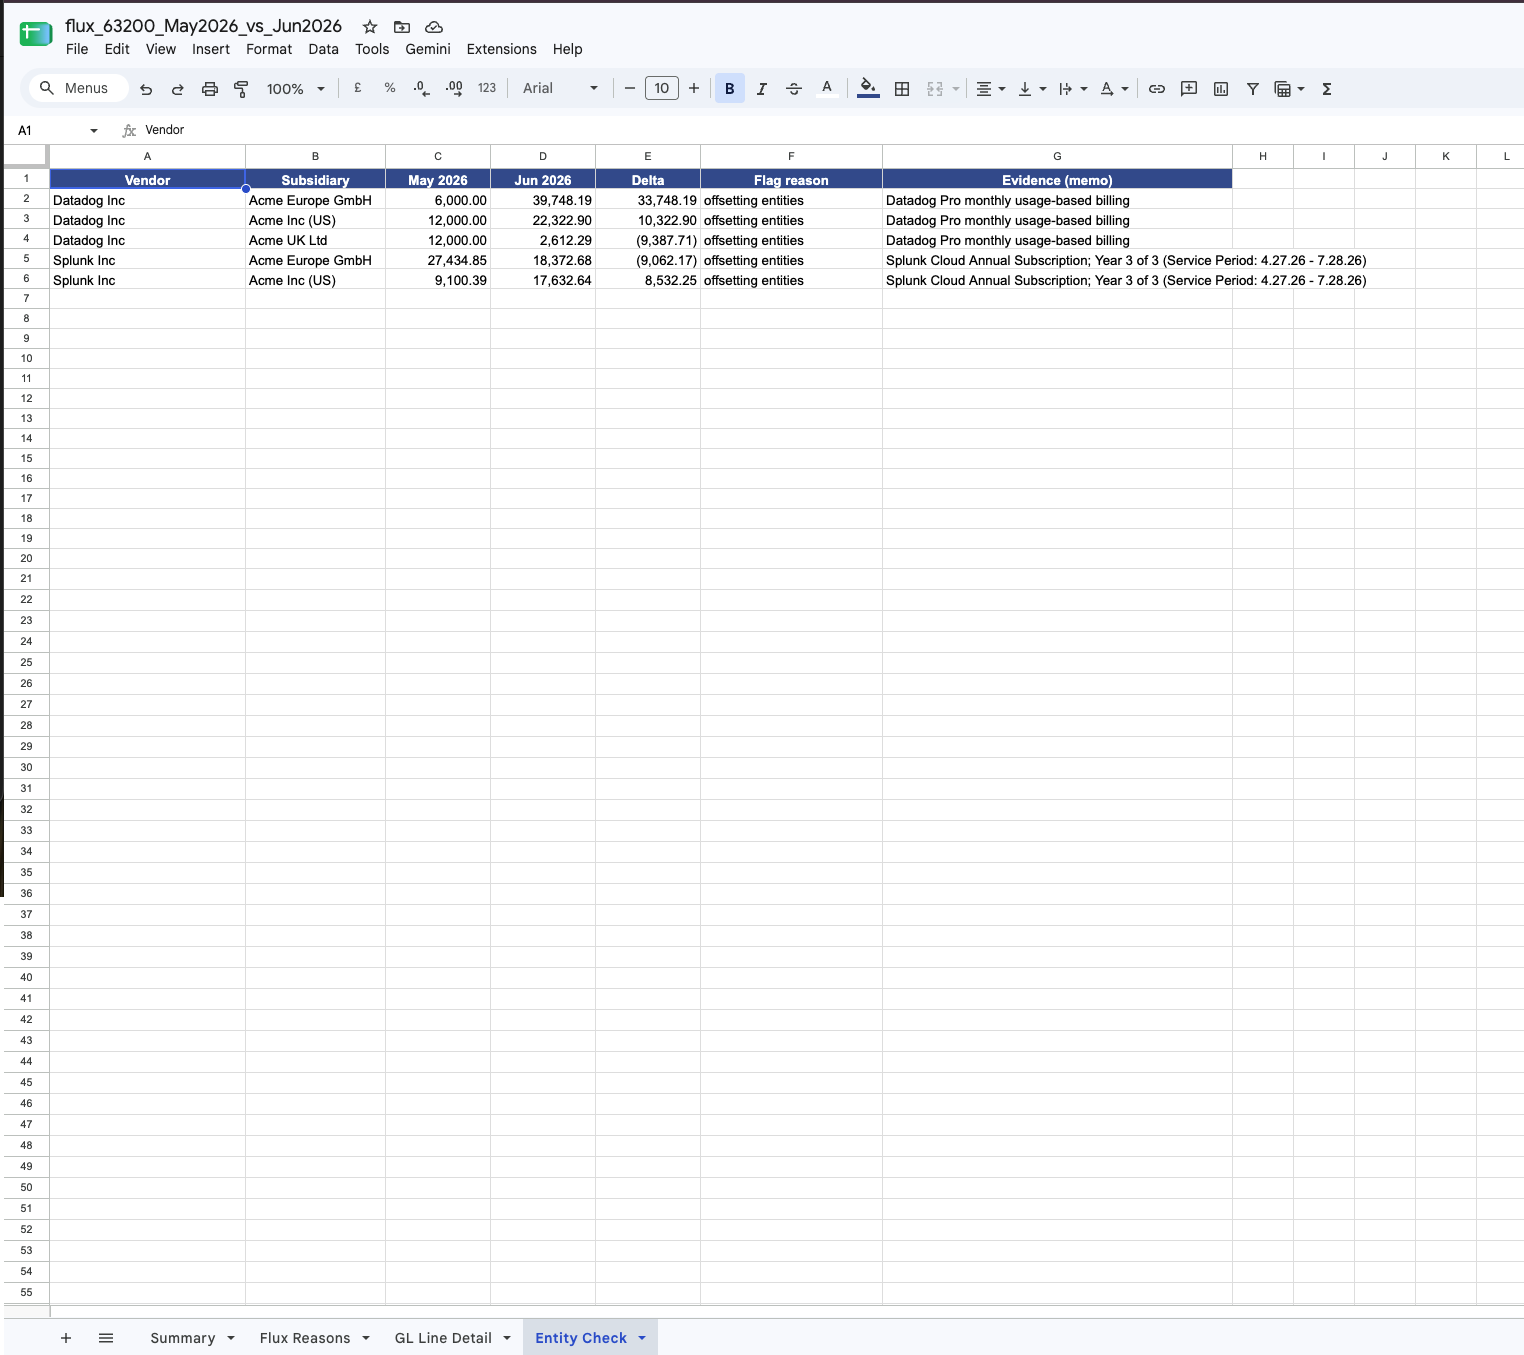
- Entity Check — (consolidated runs) any vendor whose movement looks like it was booked to the wrong entity, flagged for review.
How to use it
-
Have a GL export ready as
.xlsxor.csv. It needs, at minimum, columns for accounting period, account number, subsidiary, and an amount (or Debit + Credit). A memo/description column is what makes the "reasons" useful, and a vendor column lets it roll up by vendor. Column names don't have to be exact — the skill auto-maps common variants (Vendor/Supplier/Payee, Amount/Net Amount, Entity/Company, etc.). Seeassets/sample_gl_data.xlsxfor the expected shape. -
Ask for a flux report, e.g. "Why did account 63200 move from May 2026 to June 2026?" or "Run a variance report on accounts 63200 and 63300, all subsidiaries." The skill asks only for whatever you didn't specify:
- Account(s) — one, or several to combine into one flux ("group").
- Period range — a base period and a compare period.
- Subsidiary —
ALL(consolidated, the default) or one entity.
-
Get the workbook back. You'll see a one-line headline in chat and a downloadable file.
Try it now
- Run the skill in your AI assistant (Claude, etc.) after installing
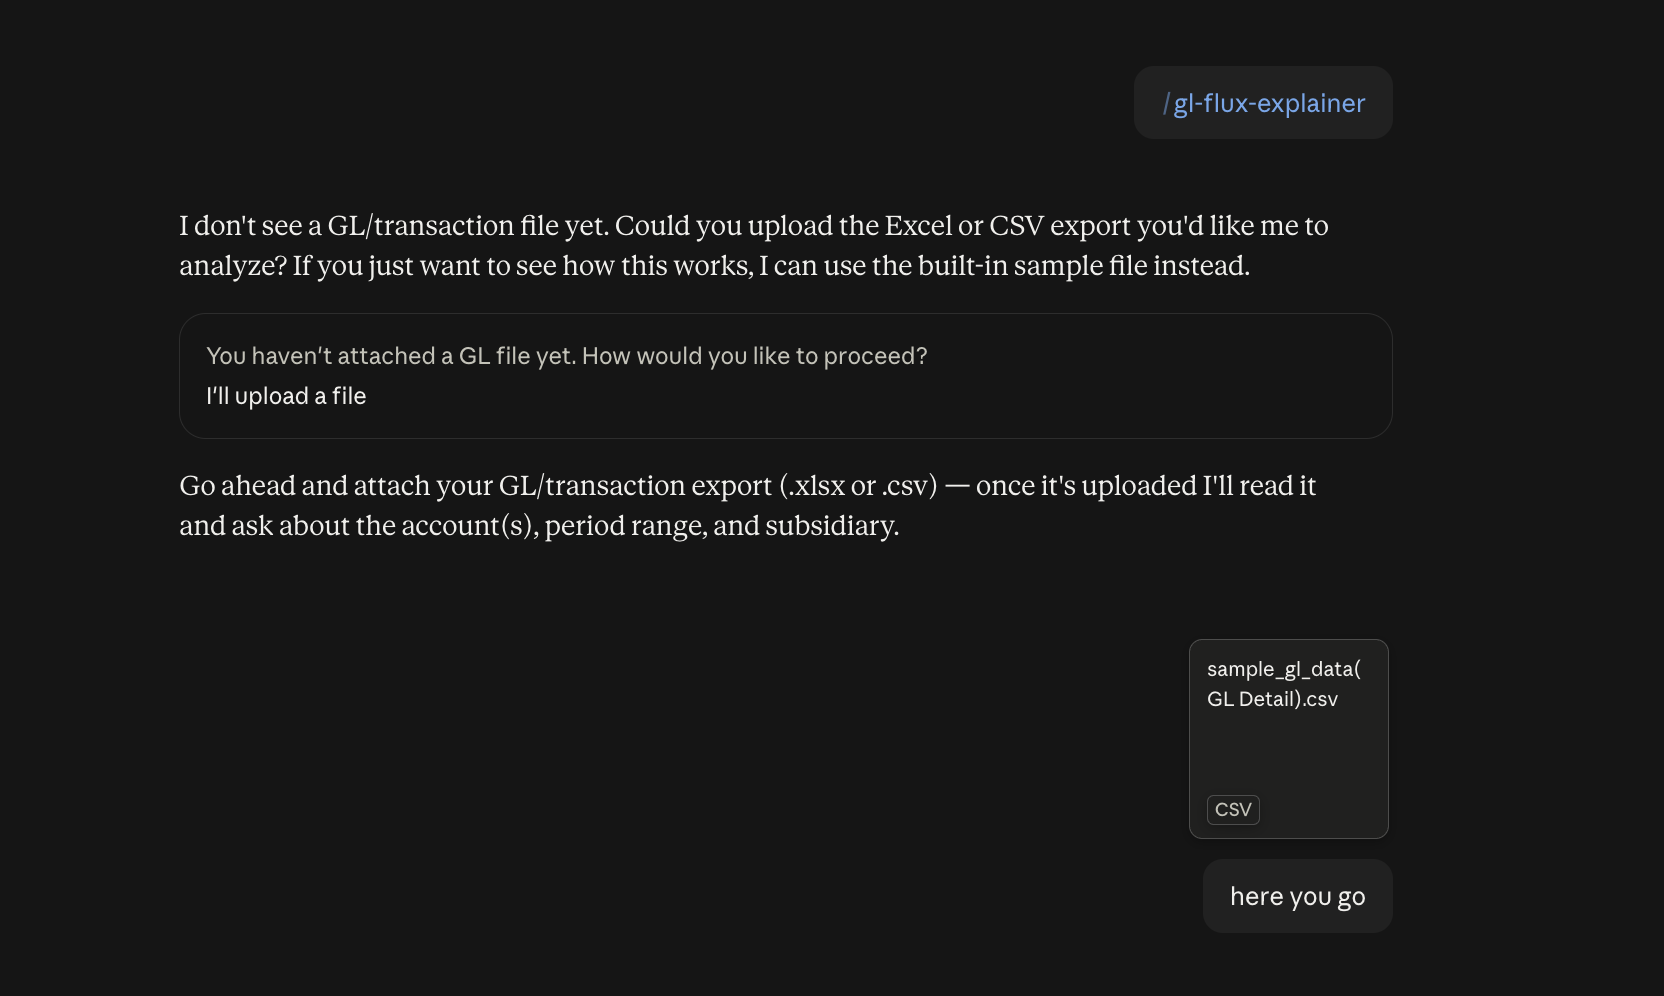
SKILL.md. - Upload the sample data file — use
assets/sample_gl_data.xlsxprovided in this repo.
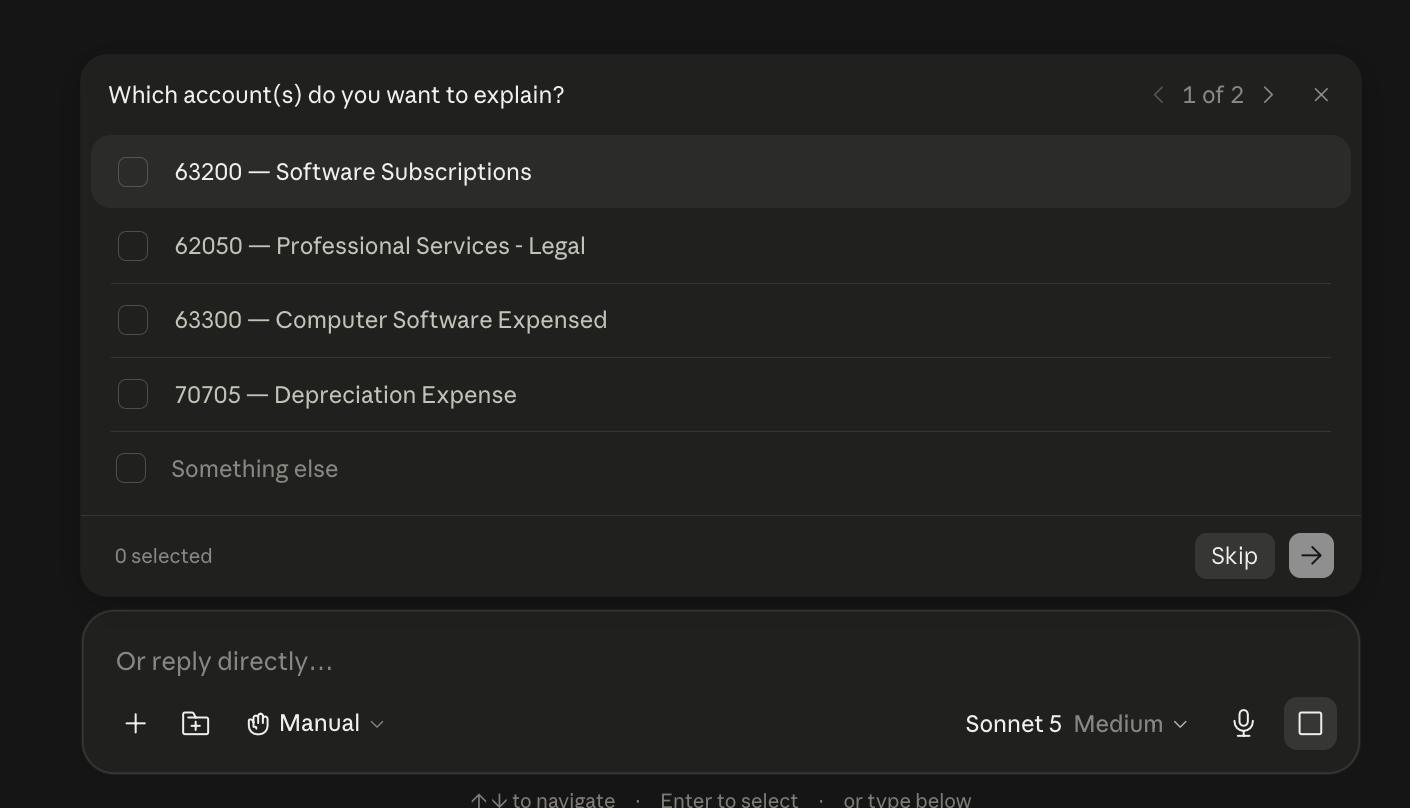
- Select an account — pick any account number from the sample (e.g.
63200) for which you want to calculate the flux.
- Choose your subsidiary scope — enter a specific entity name or
ALLfor a consolidated view across all subsidiaries. - Get your output — the skill returns a CSV file containing the reasons behind the flux: which vendors drove the change, by how much, and the memo text that proves it.
Files
The skill itself is a single self-contained file — SKILL.md — which includes the full
engine code inline (Appendix A). The rest are companion files provided separately:
SKILL.md— the skill. Instructions the assistant follows, with the complete engine embedded in Appendix A (no external script needed). Requirespandasandopenpyxlat run time.assets/sample_gl_data.xlsx— a realistic multi-vendor, multi-subsidiary example you can run immediately to see the output format (includes an FX Rates sheet).flux_63200_May2026_vs_Jun2026.xlsx— an example of the output the skill produces.
Output file structure
The skill produces an Excel workbook with four sheets. Here is exactly what each one contains, based on a real output (flux_63200_May2026_vs_Jun2026.xlsx):
Sheet 1 — Summary
A header block followed by a vendor delta table.
| Row | Content |
|---|---|
| 1 | Report title |
| 2 | Scope line: account(s), period range, subsidiary filter, reporting currency |
| 3 | Headline: opening total → closing total, delta amount, delta % |
| 4 | FX note (whether currency translation was applied) |
| 6+ | Vendor delta table — one row per vendor with May amount, June amount, and delta |
Example headline: Total: USD 153,706.07 → 207,701.29 (delta +53,995.22, +35.1%)
Sheet 2 — Flux Reasons
The top movers, each grounded in verbatim memo text pulled from the GL.
| Column | Description |
|---|---|
| Vendor | Vendor name |
| Change | increase or decrease |
| May 2026 | Total spend in base period |
| Jun 2026 | Total spend in compare period |
| Delta | Difference (positive = increase) |
| Memo evidence (verbatim) | Exact memo text from the GL lines that explain the move |
Example row: Datadog Inc — increase — $30,000 → $64,683 (+$34,683) — "Datadog Pro monthly usage-based billing | Datadog reclass - move cost to EU entity"
Sheet 3 — GL Line Detail
Every individual GL transaction line in scope, in one reporting currency, with a running balance. 16 columns:
| Column | Description |
|---|---|
| Account (Line): Name | Account name |
| Type | Transaction type (e.g. Bill) |
| Date | Transaction date |
| Document Number | Bill/journal number |
| Memo | Header-level memo |
| Description (Line Level) | Line-level description |
| Debit (USD) / Credit (USD) | Gross debit and credit in reporting currency |
| Balance | Running total of net amount within this window |
| Amount (Net USD) | Net amount in reporting currency |
| Amount (Foreign Currency) | Original amount in the subsidiary's currency |
| Currency: Name | Source currency (USD, EUR, GBP, etc.) |
| Cost Center: Name | Cost center |
| Subsidiary: Name | Entity (e.g. Acme Europe GmbH) |
| Vendor: Name | Vendor |
| Accounting Period: Name | Period (e.g. Jun 2026) |
Sheet 4 — Entity Check
Flags vendors whose movement looks like it may be miscoded across entities — a movement in one subsidiary is offset by a reverse movement in another, netting near-zero at the consolidated level.
| Column | Description |
|---|---|
| Vendor | Vendor name |
| Subsidiary | Entity where the anomaly was detected |
| May 2026 / Jun 2026 | Period totals for this vendor × entity |
| Delta | Movement at the entity level |
| Flag reason | Why it was flagged (e.g. offsetting entities) |
| Evidence (memo) | Verbatim memo from the flagged lines |
Example: Datadog Inc shows +$33,748 in Acme Europe GmbH but −$9,388 in Acme UK Ltd in the same period — flagged for review.
What it deliberately does not do
- It won't guess a driver a memo doesn't support.
- It won't assert a booking error is confirmed — entity anomalies are flagged "for review".
- It doesn't connect to any accounting system; it only reads the file you give it.